
diff options
Diffstat (limited to 'docs/project')
| -rw-r--r-- | docs/project/benchmarking.md (renamed from docs/project/profiling.md) | 49 |
1 files changed, 29 insertions, 20 deletions
diff --git a/docs/project/profiling.md b/docs/project/benchmarking.md index d734588b2..0e3578237 100644 --- a/docs/project/profiling.md +++ b/docs/project/benchmarking.md @@ -1,19 +1,25 @@ +Bun is designed for speed. Hot paths are extensively profiled and benchmarked. The source code for all of Bun's public benchmarks can be found in the [`/bench`](https://github.com/oven-sh/bun/tree/main/bench) directory of the Bun repo. + +## Measuring time + To precisely measure time, Bun offers two runtime APIs functions: -1. The web-standard [`performance.now()`](https://developer.mozilla.org/en-US/docs/Web/API/Performance/now) function +1. The Web-standard [`performance.now()`](https://developer.mozilla.org/en-US/docs/Web/API/Performance/now) function 2. `Bun.nanoseconds()` which is similar to `performance.now()` except it returns the current time since the application started in nanoseconds. You can use `performance.timeOrigin` to convert this to a Unix timestamp. -## Benchmarking `Bun.serve` +## Benchmarking tools -You will need an HTTP client which is at least as fast as `Bun.serve()`. +When writing your own benchmarks, it's important to choose the right tool. -That means popular Node.js-based benchmarking tools like **autocannon is not fast enough**. +- For microbenchmarks, a great general-purpose tool is [`mitata`](https://github.com/evanwashere/mitata). +- For load testing, you *must use* an HTTP benchmarking tool that is at least as fast as `Bun.serve()`, or your results will be skewed. Some popular Node.js-based benchmarking tools like [`autocannon`](https://github.com/mcollina/autocannon) are not fast enough. We recommend one of the following: + - [`bombardier`](https://github.com/codesenberg/bombardier) + - [`oha`](https://github.com/hatoo/oha) + - [`http_load_test`](https://github.com/uNetworking/uSockets/blob/master/examples/http_load_test.c) +- For benchmarking scripts or CLI commands, we recommend [`hyperfine`](https://github.com/sharkdp/hyperfine). It's an easy way to compare Recommended HTTP clients: -- [`bombardier`](https://github.com/codesenberg/bombardier) -- [`oha`](https://github.com/hatoo/oha) -- [`http_load_test`](https://github.com/uNetworking/uSockets/blob/master/examples/http_load_test.c) ## Measuring memory usage @@ -26,8 +32,9 @@ The `bun:jsc` module exposes a few functions for measuring memory usage: ```ts import { heapStats } from "bun:jsc"; console.log(heapStats()); - -// will show something like this: +``` +{% details summary="View example statistics" %} +```ts { heapSize: 1657575, heapCapacity: 2872775, @@ -129,23 +136,18 @@ console.log(heapStats()); } } ``` +{% /details %} JavaScript is a garbage-collected language, not reference counted. It's normal and correct for objects to not be freed immediately in all cases, though it's not normal for objects to never be freed. -You can force garbage collection to run manually by calling: +Tp force garbage collection to run manually: ```js -const synchronously = true; -Bun.gc(synchronously); +Bun.gc(true); // synchronous +Bun.gc(false); // asynchronous ``` -### JavaScript heap snapshot - -Heap snapshots let you inspect what objects are not being freed. You can use the `bun:jsc` module to take a heap snapshot and then view it with Safari or WebKit GTK developer tools. - -{% image alt="image" src="https://user-images.githubusercontent.com/709451/204429337-b0d8935f-3509-4071-b991-217794d1fb27.png" /%} - -To generate a heap snapshot: +Heap snapshots let you inspect what objects are not being freed. You can use the `bun:jsc` module to take a heap snapshot and then view it with Safari or WebKit GTK developer tools. To generate a heap snapshot: ```ts import { generateHeapSnapshot } from "bun"; @@ -161,7 +163,14 @@ To view the snapshot, open the `heap.json` file in Safari's Developer Tools (or 3. Click "JavaScript Allocations" in the menu on the left. It might not be visible until you click the pencil icon to show all the timelines 4. Click "Import" and select your heap snapshot JSON -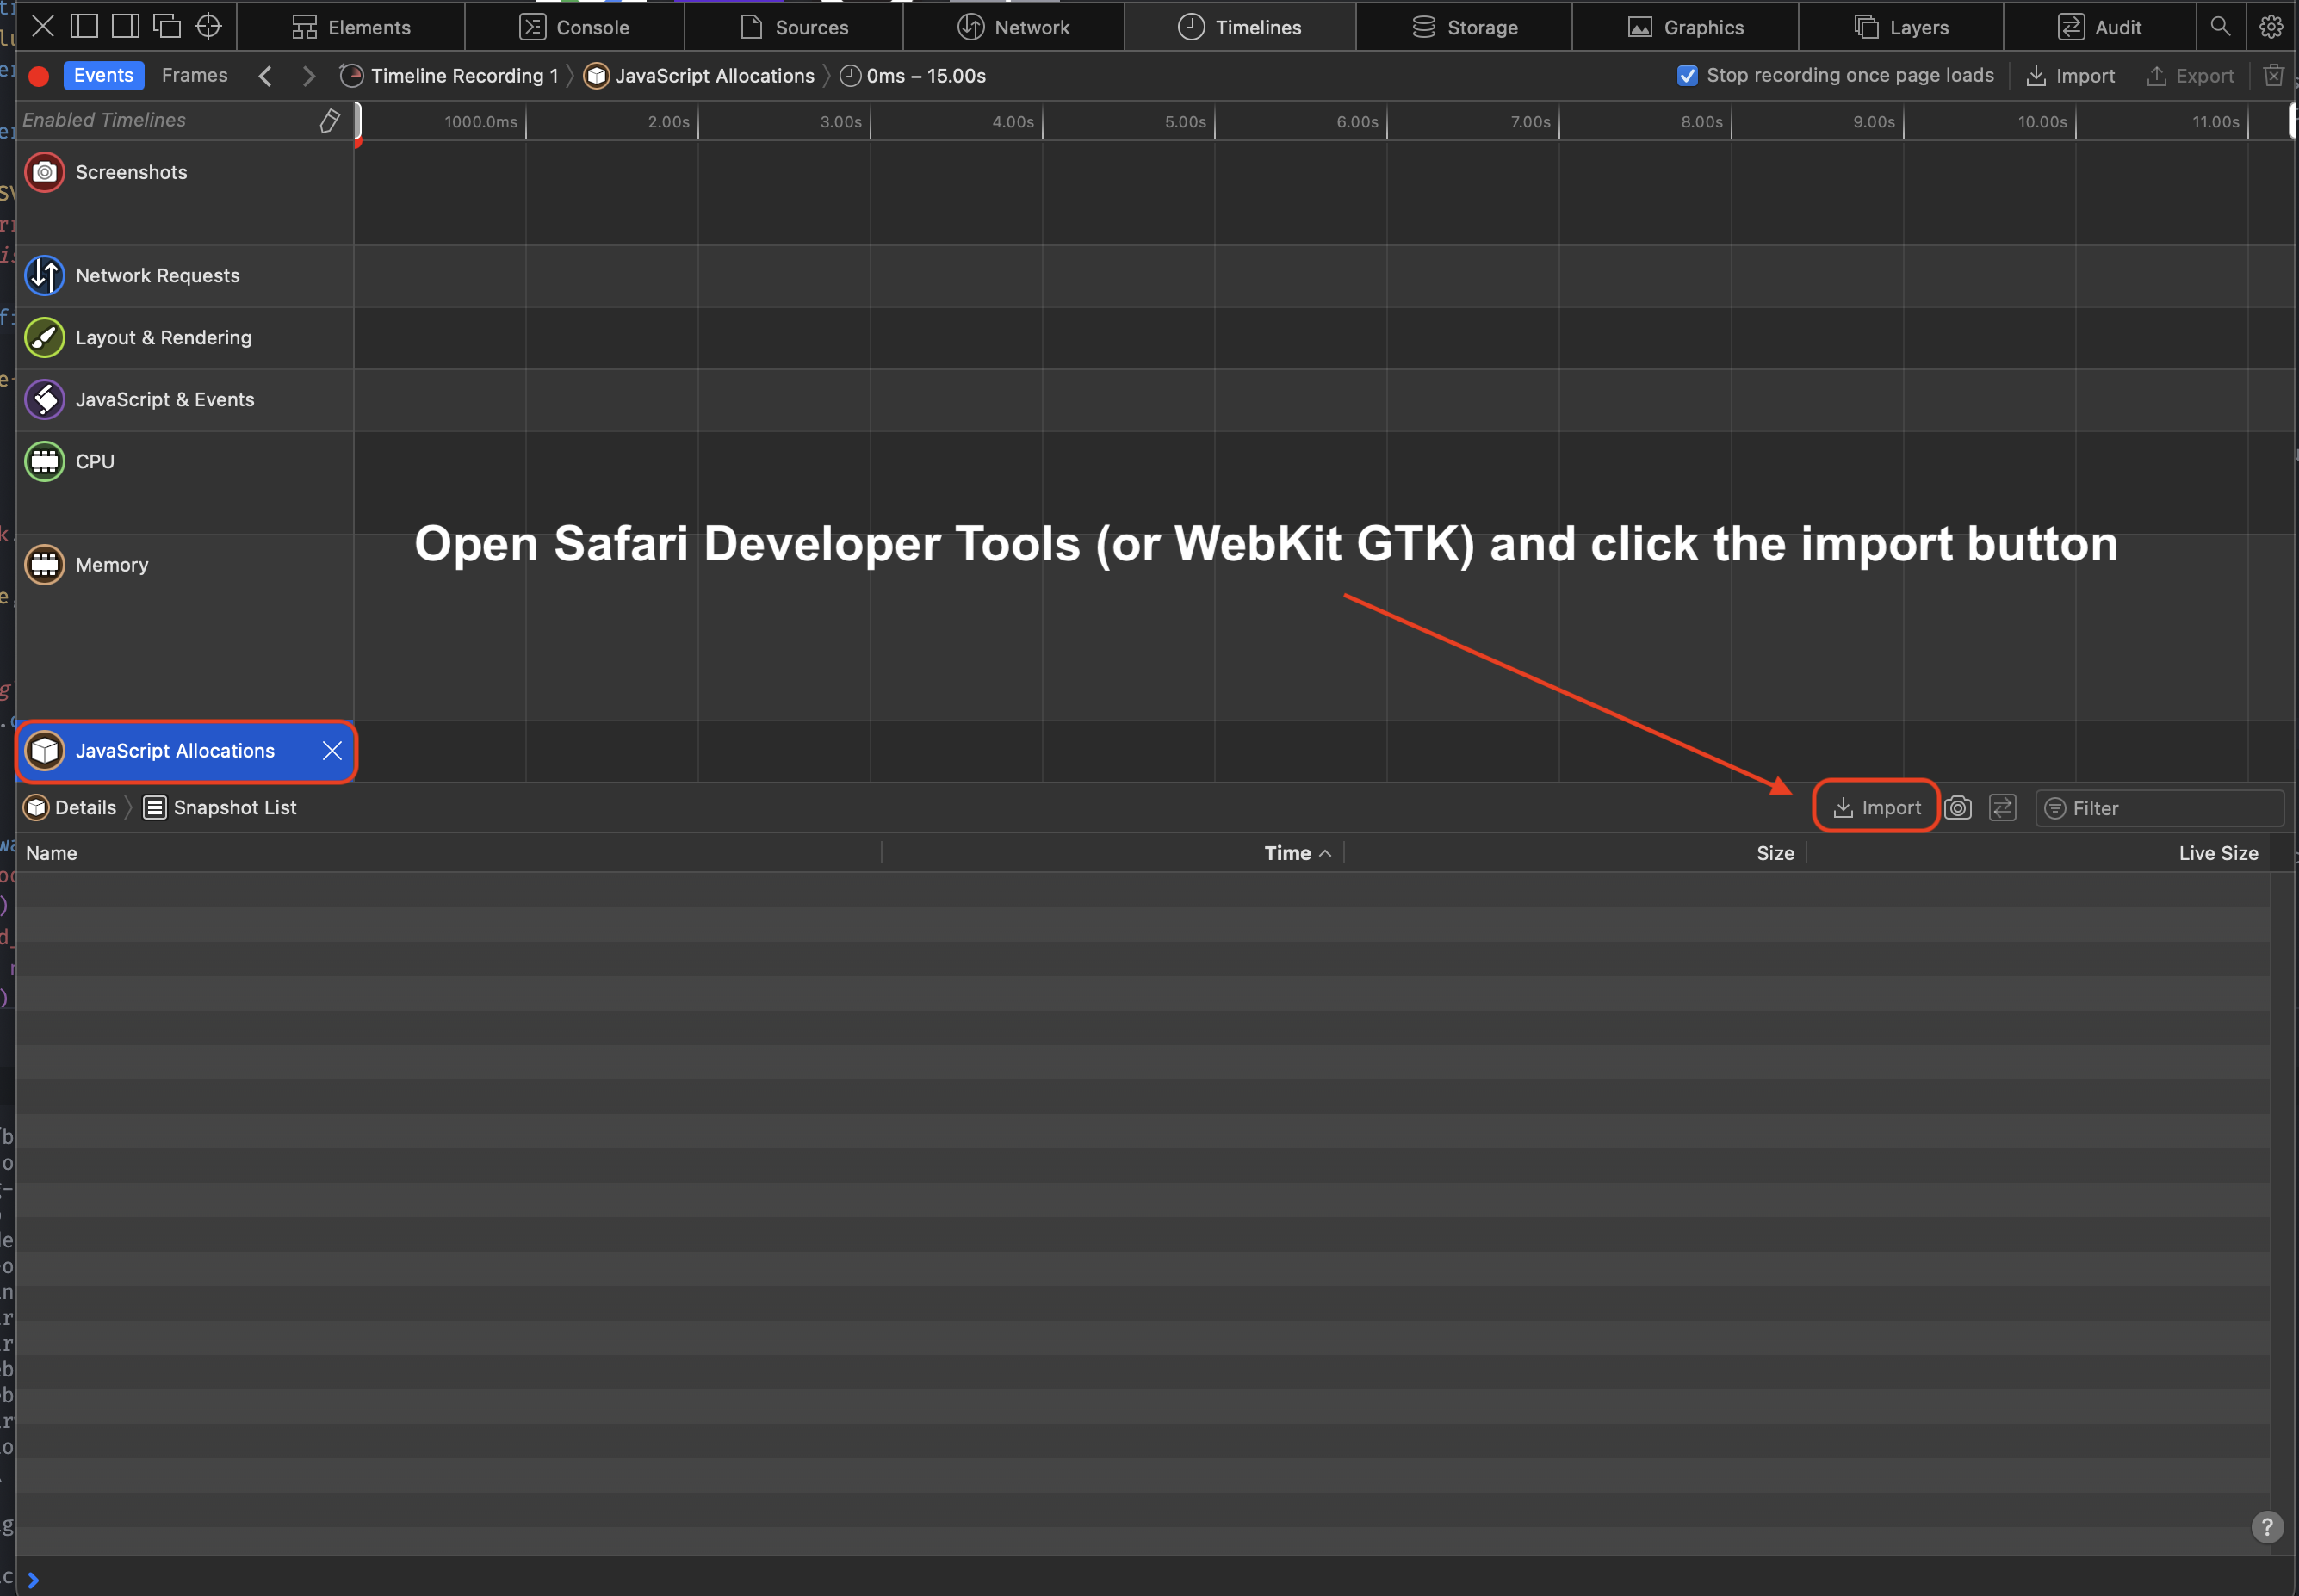 + +{% image alt="Import heap json" src="https://user-images.githubusercontent.com/709451/204428943-ba999e8f-8984-4f23-97cb-b4e3e280363e.png" caption="Importing a heap snapshot" /%} + +Once imported, you should see something like this: + + +{% image alt="Viewing heap snapshot in Safari" src="https://user-images.githubusercontent.com/709451/204429337-b0d8935f-3509-4071-b991-217794d1fb27.png" caption="Viewing heap snapshot in Safari Dev Tools" /%} + ### Native heap stats |